b


Main window controls

Transmission, Cross-section or Radiance
Spectra as totals or for separate molecules -|- Pan & Zoom with coordinate rulers

Figure 1

Figure 2

Figure 3

Figure 4

The theory behind bytran calculations is availabe at the following link.

Initializing bytran

When bytran is started it will generate two folders called "bytran" (if they do not exist already) in the "Documents" and "Downloads" directories. The "Documents/bytran" will store the results of the calculations (see Share results), and the "Downloads/bytran" will contain the config.txt configuration file along with the "HITRAN-downloads" subfolder containing the downloaded HITRAN database files.   The downloaded Total Internal Partition Sums (TIPS) files and the molparam.txt are stored in the internal OS specific application data folder not directly accessible by the user.   Additionally a TIPS file name identification file (http://www.bytran.org/exe/globalid.txt) will be downloaded from bytran.org to match the isotopes with their global id labeled TIPS data files since such information is not currently provided by hitran.org in an easily computer-accessible format.

Main window controls

The main window contains 5 standard buttons (shown in Fig 1 through 4 above): "Menu" - to open the menu (shown in Fig. 6 and 7 below), "Calc" - to run the line-by-line calculation, "Mols" - will open the Molecules window to modify the concentrations, selected states for molecules and their corresponding spectrum plot colors.   The "Total" button located at the right bottom corner of the screen is used to switch between the separate molecules and the total spectrum plots.   When the Total spectrum plot is selected, 3 more color coded round buttons will become visible at the right side of the plot (see Fig 2 and 4 above).   The black and red buttons are used to show / hide the total high resolution and the instrument function processed spectra respectively.   The gray round button with the "R" letter is used to switch between the absorption spectrum plot in the current units and its corresponding Radiance spectrum.   Switching between the Radiance and Absorption may also be carried out from within the Vertical axis menu.   The total spectra are automatically recalculated from the stored calculated separate molecule spectra (included in the last calculation) if the molecular selected states are changed in the Molecules window.

Spectrum plot, pan & zoom

Starting with bytran version 1.3 the spectrum zoom was modified and the spectrum pan along the X and Y axes was added.   Additionally the coordinate rulers shown in Fig. 1 and 2 were added and are enabled upon spectrum zoom to allow better identification of the absorption values for wavelengths of interest.   To hide the coordinate rulers on zoom, uncheck the "Enable rulers on zoom" option under the Vertical axis menu.

NOTE:  Individual molecules spectra are not plotted when a spectrum is too weak (so that the maximum amplitude along the entire spectral range is less than about 1 pixel on the screen).   To enable plotting of such weak spectra resulting in a flat line "minimum absorption", the maximum scale value ( under the Vertical axis menu ) has to be decreased accordingly.

Molecules and Menu

Molecules (concentration, selected state, plot color) -|- Menu options

Molecules

The molecules window allows changing the molecular concentrations, selected states and their corresponding plot colors.   The line-by-line calculation is performed for all molecules or only the selected ones depending on the setting of the switch located at the bottom of the Molecular window (see Fig. 5 above).   After the calculation is complete it is possible to add / remove molecular contributions to / from the displayed spectra (including the total spectrum) without a recalculation by deselecting molecules in this window.   To modify the molecular spectrum plot colors click on their corresponding color box to open the color modification window.

If a humidity sensor is connected (i.e. SensorTag) the option to read in H2O concentration from the sensor as opposed to the manual entry will be displayed at the top or left side of the molecular window as shown in Fig. 5 above.   Enabling / disabling the humidity sensor is also available under the Sensors option in the main menu (see Fig. 7 above) as an alternative.

NOTE:  The concentrations are stored in the application in the units of parts per million by volume (ppmv).   As such changing the total pressure will also change molecular absolute partial pressures which are used in line-by-line calculations subsequently resulting in changed computed spectra.   Due to the above, for fixed absolute partial pressure calculations it is recommended to specify the total atmospheric pressure first, and then change the molecular concentrations.

Menu page 1 of 2

Wavelengths -|- Wavelength resolution

Wavelengths
Figure 8

Wavelength resolution
Figure 9

Wavelengths

The minimum and maximum calculation spectral boundaries specify the hard cutoff calcualtion range.   Currently bytran does not include any contribution from spectral lines or line wings located outside of the calculation spectral range specified.   The calculations are carried out on an equidistant wavenumber grid with the resolution specified in absolute units or as the number of data points (Fig. 8 and 9 above).

Wavelength resolution

The wavelength resolution (Fig. 9 above) may be specified as:

( 1 )   An absolute value in current wavelength units
( 2 )   As the number of data points along the wavelength span
( 3 )   As a combination of options ( 1 ) and ( 2 ) above where the coarser resolution specified by the two methods is used in calculations. This third option was introduced to automatically reduce the number of data points for shorter calculation wavelength spans to speed up the calculations for narrower wavelength spans.

Menu page 1 of 2

Vertical Axis -|- Atmosphere model

Vertical axis

The vertical axis may be specified as Transmission, Absorption, Optical Depth or Cross-section (Fig. 10 above).   Additionally the spectrum may be switched to show the corresponding Radiance (Fig. 11 above).   Just like for the cross-sections (Fig. 10 above) it is possible to have the Radiance spectrum maximum scale value automatically recalculated to fit the calculated spectrum.   The coordinate rulers shown in Fig 1 and 2 may be switched on and off in this window.   Starting with version 1.3 the Radiance is now also available as a separate molecules plot to better illustrate the molecular bands contributing to the total Radiance spectrum.

Atmosphere model

Bytran has the US Standard 1986 atmospheric models built in (see Fig. 12 above).   To apply the ground level values from the currently selected atmospheric model to the bytran calculation variables (i.e. molecular concentrations, temperature and the total pressure), press the "Apply" button located at the top left corner of the Atmospheric model window shown in Fig. 12, and then confirm the overwrite of the currently used values.

Menu page 1 of 2

Pathlength -|- Total pressure -|- Temperature

Pathlength, Total pressure and Temperature

The pathlength, Total pressure and Temperature (Fig. 13, 14 and 15 above) may be specified in different units.   The Total pressure and Temperature may also be automatically read in from built-in or the SensorTag sensors when available.   The option to feed in the temperature and total pressure values form the built in sensors as opposed to manual entry shown in Fig 14 and 15 above will only be displayed if a connected thermometer or barometer sensor is detected.   The sensor versus manual input selection is also available under the Sensors menu.

Menu page 2 of 2

HITRAN options -|- HITRAN settings

HITRAN options
Figure 16

HITRAN settings
Figure 17

HITRAN options

Bytran relies on the online version of the HITRAN database available at HITRAN.org.   There are 3 options for the usage of the HITRAN database by bytran (shown in Fig. 16 above):
( 1 )   By default HITRAN is downloaded on a need-to basis in small segments totalling around 5Mbytes each and stored locally for later reuse (within the "Downloads/bytran/HITRAN-downloads" folder under Android). Repeated calls with the same spectral regions requested use locally stored data as opposed to HITRAN.org.
( 2 )   Complete download of the entire HITRAN database from HITRAN.org to completely eliminate the need to connect to the HITRAN server later. Optional manual placement of the cumulative HITRAN database file (i.e. HITRAN2012.par) into the "Downloads/bytran" folder is also possible under Android and the desktop operating systems.
( 3 )   The third HITRAN database option will access the HITRAN.org every time the program runs without saving any data to the portable device.

HITRAN settings

The HITRAN database may now be stored and accessed in a binary format as an option.   The binary mode was introduced to speed up the HITRAN database read times.   The HITRAN database settings window (Fig. 17) allows selecting the HITRAN database storage mode (ASCII, binary, or both ASCII and binary) as well as to select which files (ASCII or binary) are to be used in calculations.

NOTE:  If the option to save the downloaded data in both the ASCII and binary format is selected please note the following.   When the HITRAN database is downloaded the currently active (binary or ASCII) HITRAN database folder (specified by the "Files to be used in calculation" option) is used to determine which spectral region files are missing and need to be downloaded.  In doing so NO CHECK of which spectral region files are already present in the inactive folder (ASCII or binary) is performed.   As such during the download the files in the inactive folder will be overwritten with the newly downloaded ones if their spectral regions are absent in the active folder files.   Only the files in the active folder are downloaded in a supplementary way so that only the missing spectral region files are downloaded.

Android phones only:  Additionally an option was introduced to be able to store the HITRAN downloaded data, the configuration file and the calculation results on a removable SD card under the Android operating system.

Menu page 2 of 2

Instrument function -|- Line options

Instrument funct.
Figure 18

Line options
Figure 19

Instrument function

The instrument function spectral smoothing in bytran represents a direct conversion of the HAPI's Python routines into Qt/C++ and is used to simulate the performance of an optical spectral instrument with lower resolution than that available through the HITRAN line-by-line calculations.   The instrument function in bytran is applied to the total high resolution absorption spectrum as well as the corresponding Radiance spectrum.

Line options

The lineshapes available in bytran are currently limited to the Doppler, Lorentz, and Voigt.   The wing contribution of the individual absorption lines may be specified in either absolute units of cm-1 or the saturated half widths (the larger of the 2 values will be used in calculations).   Specifying the intensity threshold will cut-off weak lines below the threshold value indicated from the calculations.   The line intensity threshold value is applied to the adjusted line intensity $S_{ij}^{*}$ mentioned in in this link.   Other options include the "Lineshape broadening type" and the "Usage of the line shift" as shows in Fig. 16.   Bytran does not currently include any spectral line absorption contribution outside of the specified wavelength range, as such care must be taken to expand the calculation range accordingly to ensure the required precision at the wavelengths of interest.

Menu page 2 of 2

Sensors -|- Results sharing

Sensors

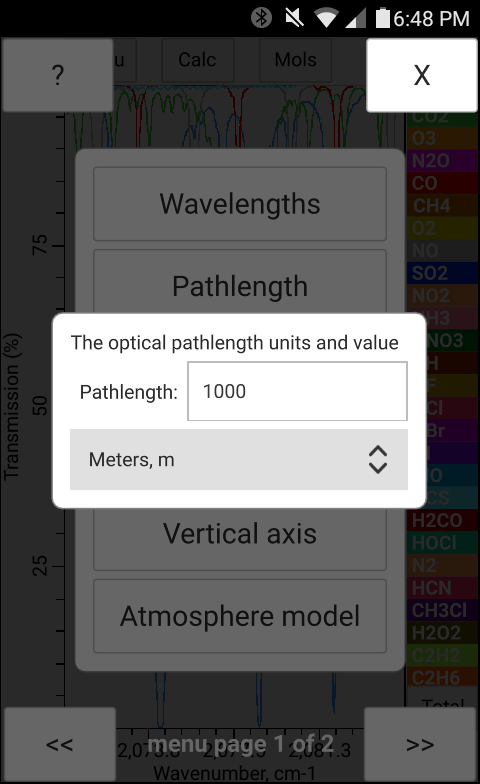
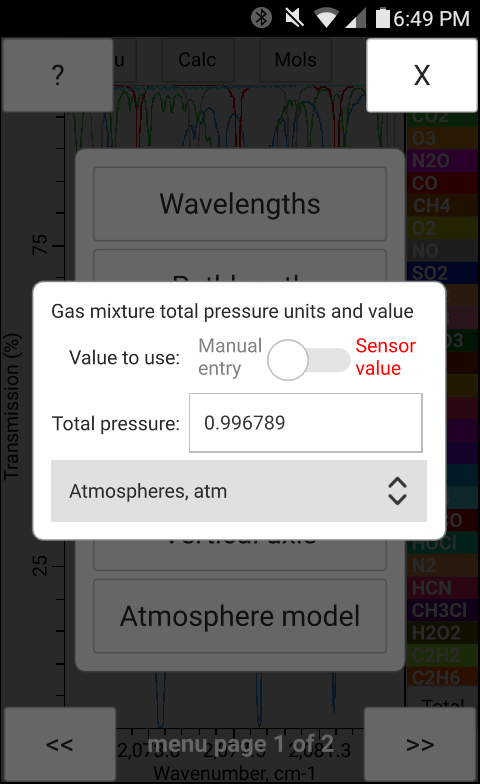
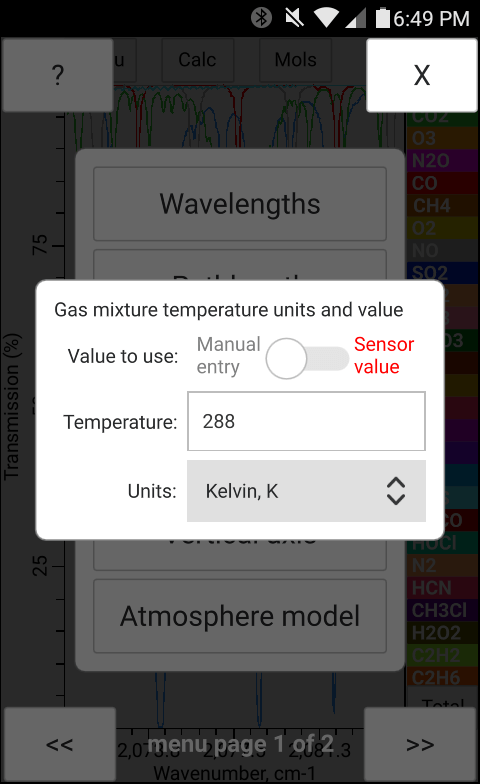
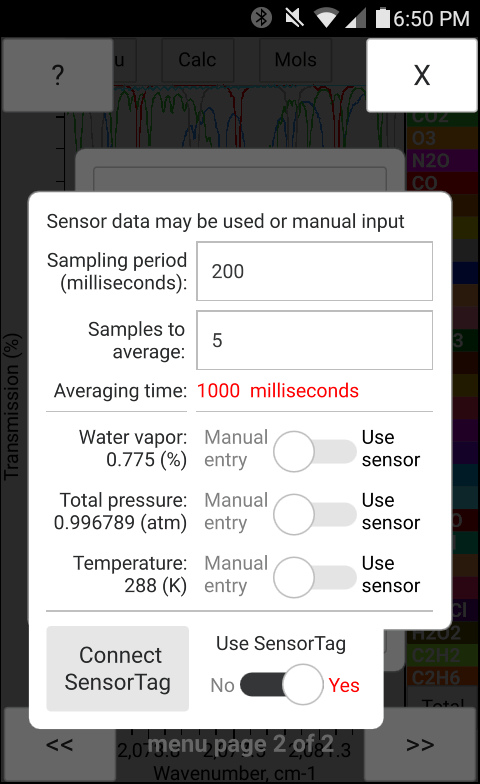
The total pressure, temperature and the concentration of H2O may be entered manually in bytran or else read in from built in or external sensors.

Version 1.3 of bytran supports:
(1)   Cell phone built in Temperature and Total pressure sensors under Android,
(2)   External bluetooth SensorTag module (Baromter, Thermometer and the Humidity sensors),
(3)   Raspberry Pi's Sense HAT add-on board (Baromter, Thermometer and the Humidity sensors).

The "Sensors" menu option shown in Figure 17 contains sensor related settings.   Among the settings are the "Sampling period" and the "Number of samples to average". The total averaging time calculated as the product of the sampling period and the number of samples to averege is displayed in red.   The switches located under the settings menu as shown in Figure 17 which allow switching between the Manual and Sensor input correspond to either built in sensors (if present), or to the SensorTag module (if it is connected and enabled).   The bottom switch titled "Use SensorTag module" is responsible for switching between the built in sensors and the input from the SensorTag module.   While the built in sensors are detected automatically if present, the SensorTag module needs to be connected over Bluetooth before it can be enabled and used.

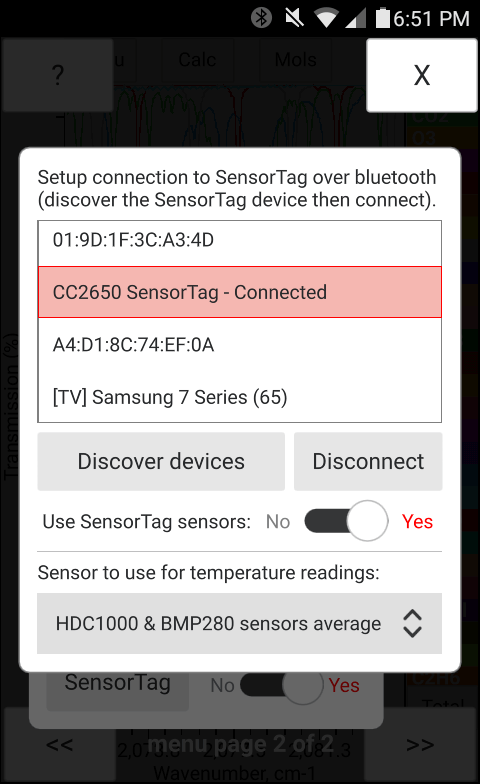
In order to connect the SensorTag module, click on the "Connect SensorTag" button in the "Sensors" window (Figure 17) to open the SensorTag connection window shown in Figure 18 and press the "Discover devices" button after enabling the "Advertizing mode" within the SensorTag module.   (The "Advertizing mode" in the SensorTag may be enabled by pressing and holding the smaller size button for a couple of seconds.   When the advertizing mode is enabled a green LED in the SensorTag module will start blinking repeatedly.)   Once the bluetooth SensorTag discovery is complete in bytran and the list (Figure 18) is populated with the found bluetooth devices, select the SensorTag record in the list and click "Connect".   Once the connection is established, the SensorTag record in the list with be updated to state "Connected".   The SensorTag has 2 different temperature sensors, it is possilbe to select input from either one of the sensors or their average (the average is used by default).   To start using the SensorTag set the "Use SensorTag" switch to "Yes" and enable the desired sensors using switches displayed in the Sensors window (Figure 18).

Share results

The results of the calculation may be shared under Android and iOS over available communication channels (i.e. email, text messaging etc.).   The generated files which may be shared include the (1) spectrum plot image, (2) the datafile with the corresponding numerical data, and the (3) configuration file with the current configuration settings.   The user may select to only share the image, the numerical data, or both (see checkbox options in Fig. 18).   If the "attach data file to message" is selected, the calculation results data file and the configuration file will be shared.   When the results of the calculation are being shared a copy of all shared files is saved into the "Documents/bytran" folder if the operating system has a permission to access the "Documents" folder, otherwise the shared data will be saved into the OS specific application data folder not directly accessible by the user.   Under desktop operating systems the data cannot me shared but may be saved to the "Documents/bytran" folder by pressing the "Save to Documents" button shown in Fig. 18 above.   Currently bytran does not provide a way to modify the folder where the results of the calculations are stored.

Menu page 2 of 2

Connect options to control bytran remotely

Connect

This option was introduced with version 1.3 to control bytran remotely over Bluetooth (Fig. 20 above), WiFi / Ethernet using WebSockets (Fig. 21 above), and the Serial port (Fig. 22 above) using the bytran communication protocol.   This feature was introduced for remote control and retrieval of bytran calculation results to facilitate simplified integration of bytran running on dedicated hardware into customized systems.

If "Broadcast manual input" is enabled (see Fig. 20, 21, and 22 above), the corresponding commands and newly assigned values will be sent over the selected communication channel (Bluetooth, WiFi / Ethernet, Serial port) when the values are manually modified withing the bytran program using the bytran graphical user interface.


www.bytran.org -|- 2018  
  Email:  bytran@bytran.org
© 2018 - 2022 Dzianis Pliutau